Reporting & analytics
Always know exactly where your agency stands
Live dashboards for revenue, MRR, cashflow and pipeline. From win/loss analysis to custom reports — everything on one screen, always up to date.
14 days free · no credit card · live in 5 minutes
18+
Ready-made reports
Live
Real-time dashboard updates
32%
More deals won through forecasting
1-click
Export to Excel & PDF
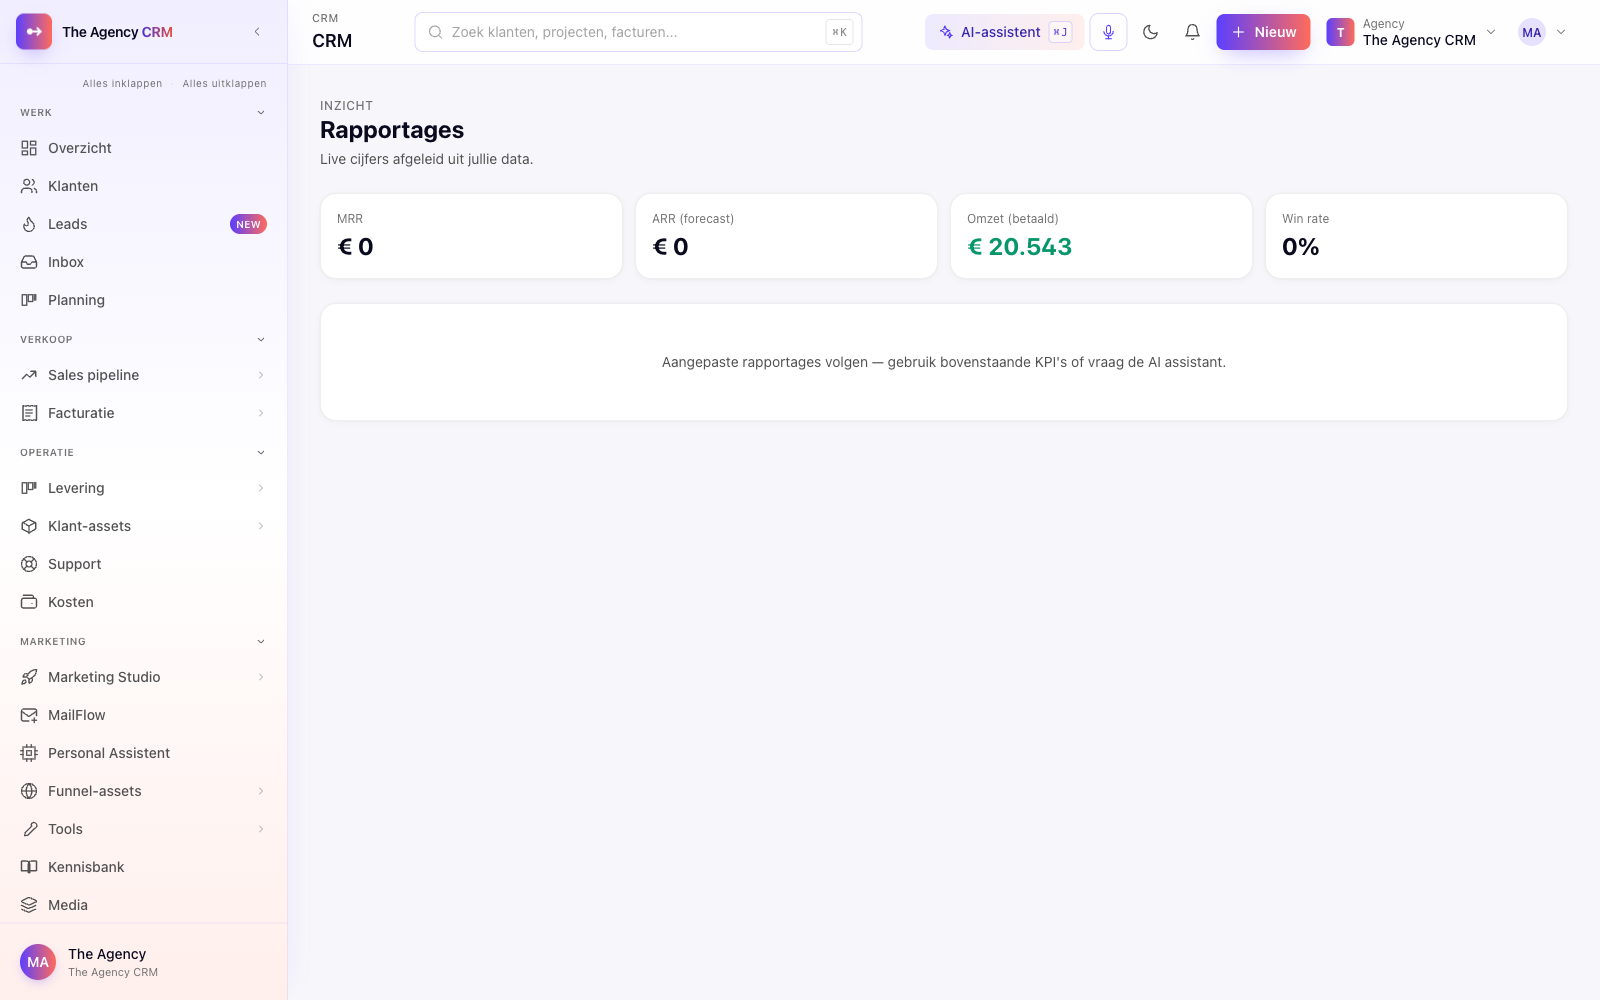
Revenue & MRR
Know every morning what your month will deliver
The revenue dashboard shows revenue, MRR, ARR and cashflow live — broken down by client, service, team or region. No more manual spreadsheets; everything pulls automatically from your pipeline and invoices.
- MRR/ARR trend with month-on-month comparison
- Cashflow forecast based on outstanding invoices
- Revenue report per client, service and team member
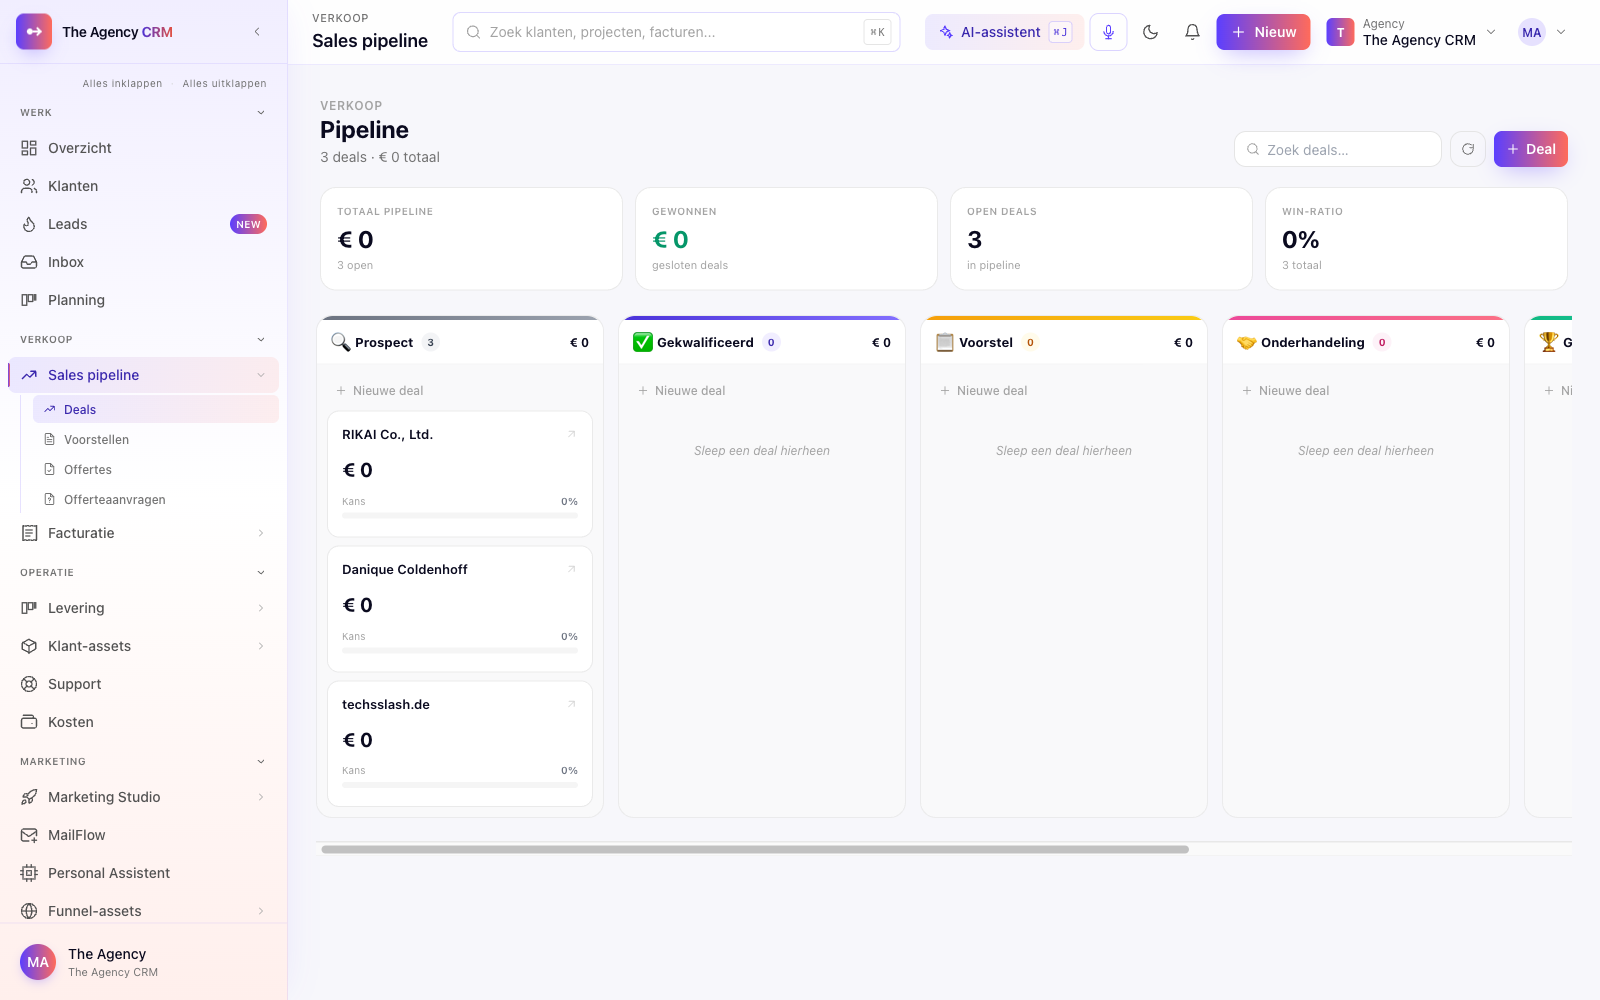
Pipeline & forecast
Predict your revenue weeks ahead
The pipeline forecast calculates expected revenue based on deal value and win probability per stage. See at a glance which deals will close this month and where you need to step in.
- Weighted forecast per pipeline stage
- Win probability automatically calculated from historical data
- Drilldown per sales rep or team member
Win/loss analysis
Learn from every deal won and lost
See exactly why deals were won or lost — by competitor, by source, by service. Use those insights to sharpen your proposition and systematically increase your win rate.
- Win/loss ratio by source, region and product
- Loss-reason reporting with trending root causes
- Compare performance by period or team member
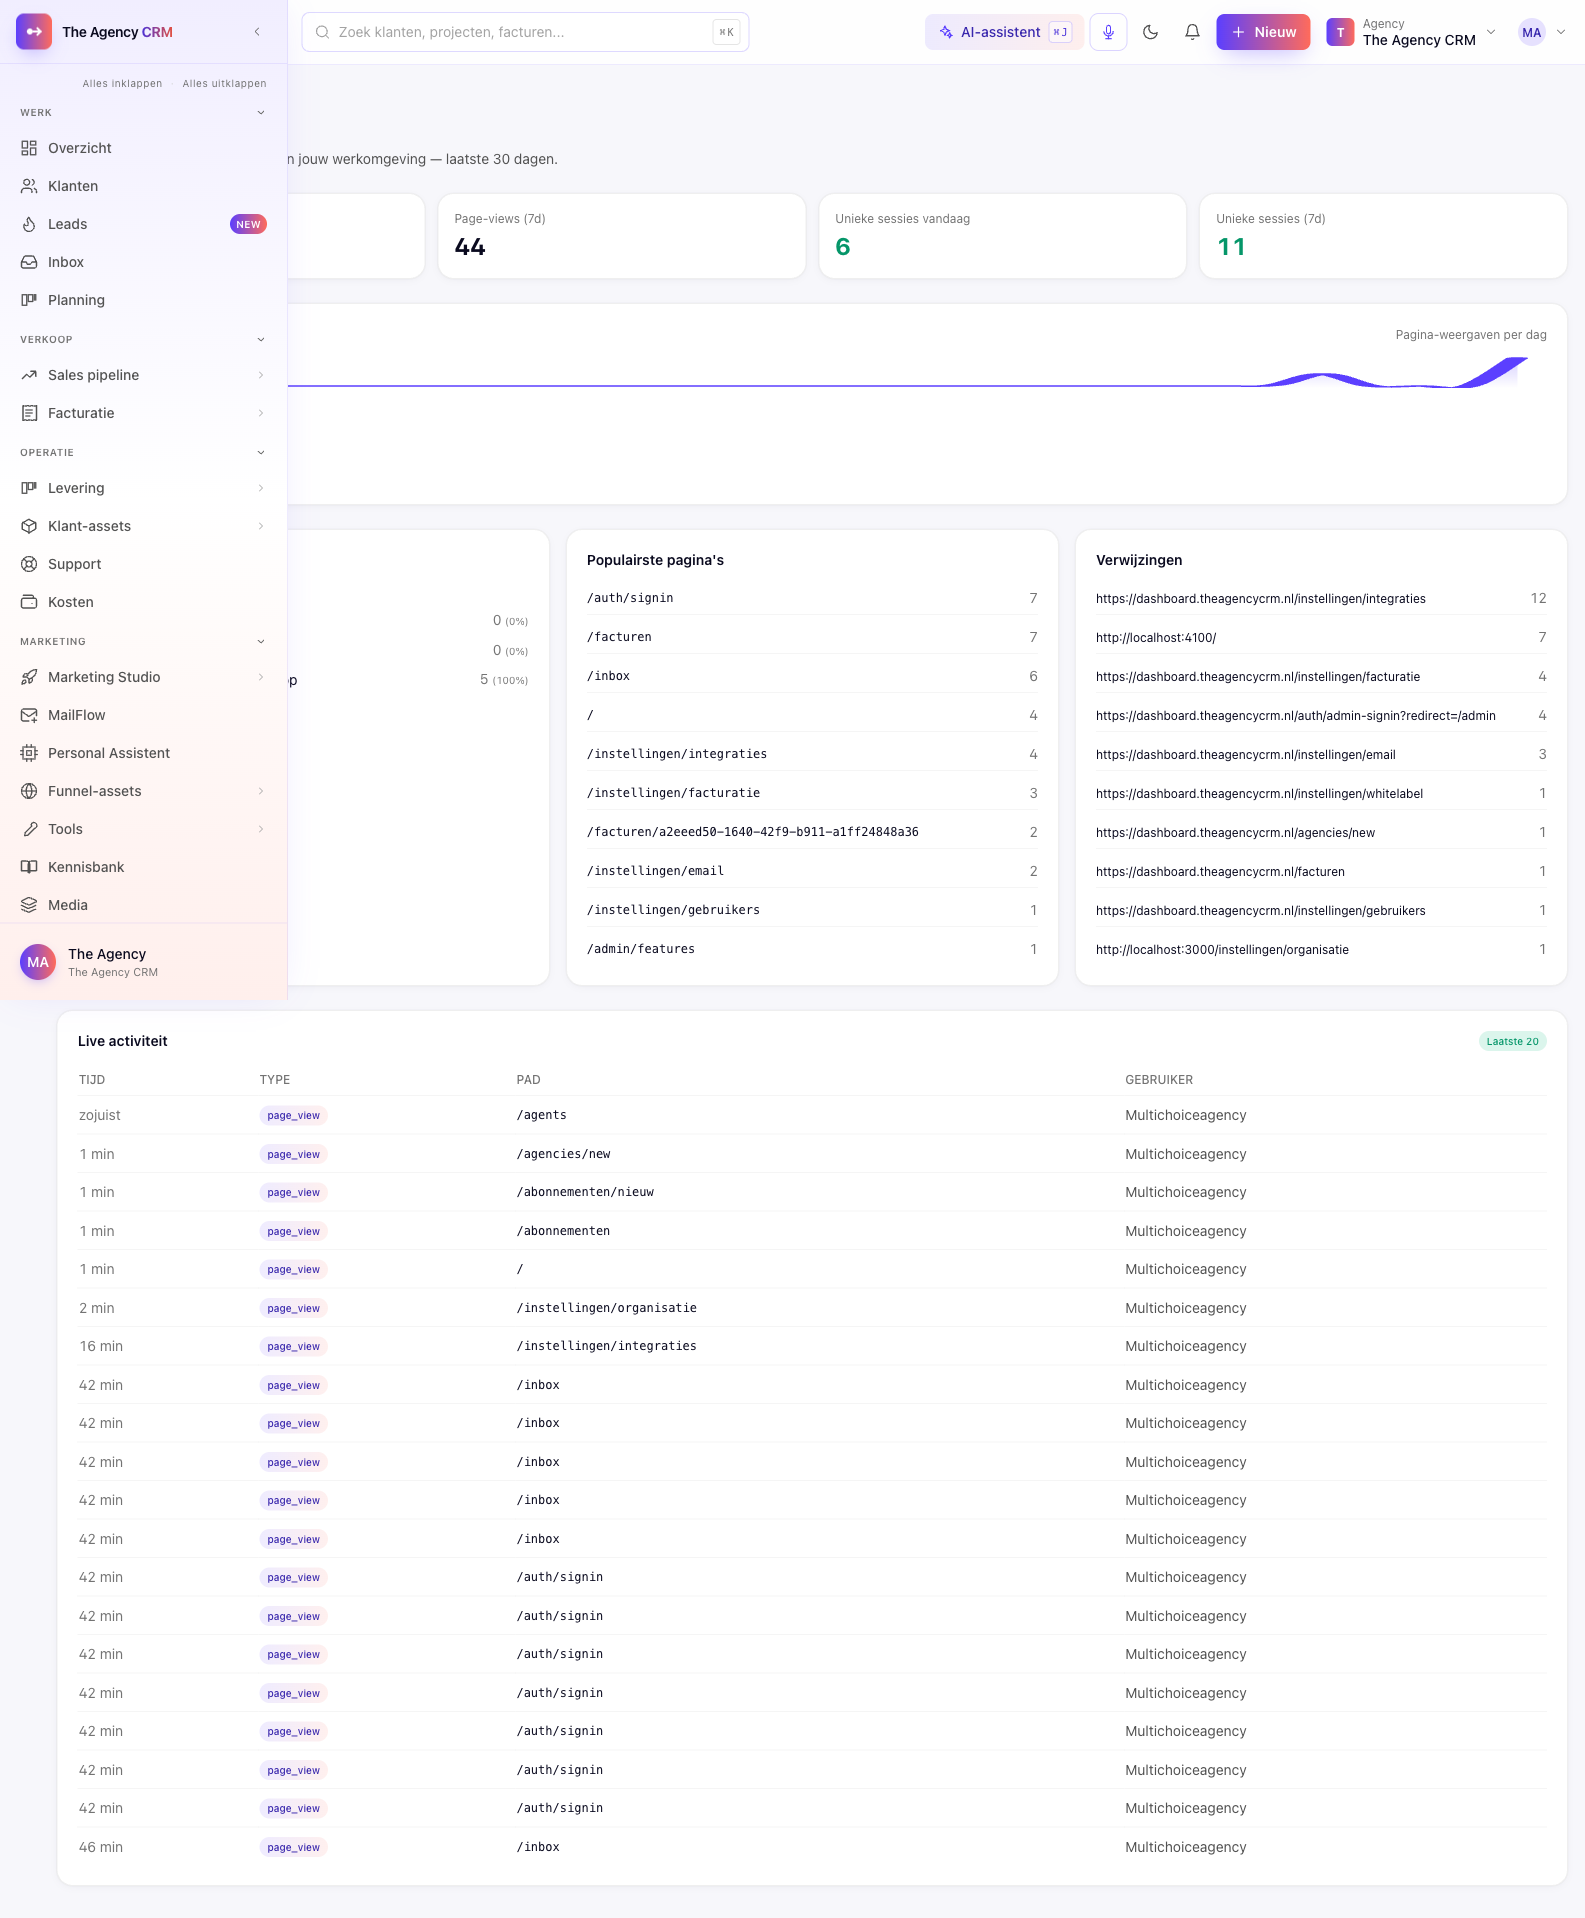
Custom reports
Build any report you need
No standard report that covers exactly what you want to see? Build your own with the drag-and-drop report builder. Add KPIs, filter by segment and share with your team or clients — in one click.
- Drag-and-drop report builder, no code required
- Shareable dashboards for clients or management
- Automatic scheduled delivery by email
Why it works
Data that drives action, not just information
Reports are only valuable if they help you make decisions. That is why every chart sits right next to the action you can take.
Real-time, always current
All figures pull live from your CRM data. No manual exports, no outdated spreadsheets — every time you open the dashboard, everything is accurate.
Fully customisable
Choose which KPIs appear on your dashboard. From MRR to average stage duration — you decide what matters for your agency.
Automatically shared
Set your weekly revenue report to go to the director automatically, or have clients receive their project report in their inbox every Monday.
"The forecast feature has completely changed our monthly planning. Every Friday we know exactly what revenue to expect that month — and where we need to push harder."
Tim van der Berg
Managing Director, Norr Agency
Related features
Reporting works even better combined with
Pipeline management
The data in your reports comes from your pipeline. Keep deals updated for an accurate forecast.
Learn moreInvoicing
Invoice data flows automatically into your cashflow and revenue reports.
Learn moreAI assistant
Ask your AI assistant questions about your reports: "What is my MRR this month?" and get an instant answer.
Learn moreIn the product
See it in action